CSV/TSV Rows to Columns Converter
What is a CSV/TSV Rows to Columns Converter?
CSV/TSV Rows to Columns Converter is a specialised program for restructuring tabular data, commonly known as a data transposition tool. It executes a matrix operation that transposes your dataset so that the first column becomes the header row and each consecutive row becomes a new column. This is a very useful method if the orientation of your data is not suitable for what your analytical software, reporting tool or database structure requires. Time series data, for example, is commonly stored with dates as rows, while many visualisation tools expect dates as column headings. This free online tool saves you the hassle of using complex spreadsheet formulas or copy pasting manually. It provides a fast, accurate and error-free approach to pivot your data structure. It handles multiple delimiters, ensuring compatibility with CSV (Comma-Separated Values), TSV (Tab-Separated Values), and other standard plain-text data formats.
- Pivots or transposes data from a row-based format to a column-based format.
- Ensures data integrity and relationships are maintained during the conversion process.
- Multiple input and output delimiters for ultimate flexibility.
- Options for trimming whitespace and quoting fields for clean, standardised output.
- Ability to quick preview, copy and download processed data.
- Reduces manual errors caused by cutting, pasting and repositioning data in spreadsheets.
How to Use Excel Convert Rows to Columns Tool
This is a simple four-step converter that is simple enough for users of any technical background to utilise. You don't need to install any software or write any code. Just set up your data with a clear header row, copy it over to the tool, choose your options and run the transpose. The program provides live data and a visual preview to check the transformation before exporting the end product. Follow the comprehensive procedures below to change your data efficiently.
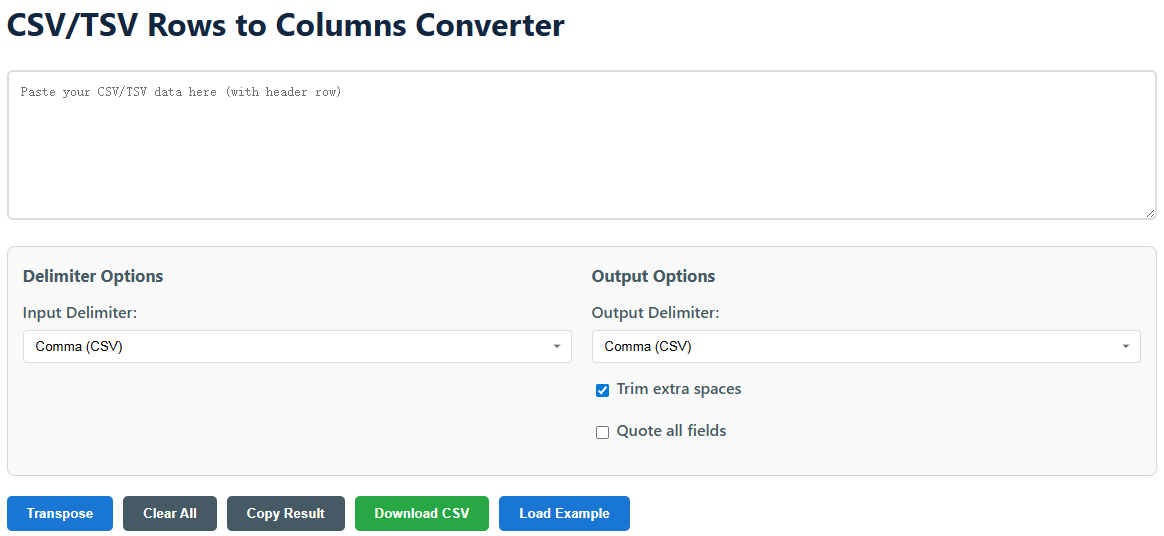
- Step 1: Prepare and Paste Your Data - Your data should include a header row on the first line. Paste the whole CSV or TSV data block from your source (e.g. spreadsheet, database export) into the "Input Data" text section. Click on “Load Example” button to see an example dataset in action.
- Step 2: Define Input & Output Settings - On the "Delimiter Options" tab, choose the character that separates your fields (e.g. Comma for CSV, Tab for TSV). Choose Custom if your file has a special delimiter, and then type it in. Then, under "Output Options," select your preferred delimiter for the transposed file and set any formatting choices like as cutting spaces or quoting all fields.
- Step 3: Execute the Transpose - Click the blue button labelled "Transpose". The program will rapidly handle your data by transposing rows and columns. The ‘Stats’ bar refreshes to show the number of rows input and output. A table of "Preview" will appear below, so you can see visually that the transformation is right.
- Step 4: Export Your Result - If the preview looks good to you, you can just click “Copy Result” to copy it to your clipboard and paste it into another application right away. Click "Download CSV" to download the material to your device as a standard .csv file that can be used in Excel, Google Sheets or any data analysis software.
- Step 5: Manage Errors & Clear Data - In case your data is inconsistent (e.g. unequal rows), you will get an error notice. Press the "Clear All" button to clear the tool altogether and start a new conversion session with new data.
- Pro Tip: Look at the Preview - Make sure you look at the created preview table. This visual verification confirms the headers and data have been transposed as you wanted and prevents downstream difficulties in your workflow.
- Pro Tip: Activate the Trim Option - If you are importing data from different sources, it is highly suggested to activate "Trim extra spaces". It cleans up stray spaces around your data points for consistency and to prevent frequent import issues down the line.
Technical Perspective on the Transposition Logic
This tool performs a core mathematical matrix transposition, applied to a data array. The principle is simple, but the actual code has to be careful with headers, delimiters and data integrity. The program reads the input text line by line and for each line it splits it into an array of cells based on the chosen delimiter. It then loops over the columns of the original data to construct new rows and reconstructs the result. This part gives a clear before and after comparison to show exactly what structural change has been made to your data.
| Original Data(Rows) | Transposed Data (Rows) |
|---|---|
|
Month,Product A,Product B,Product C Jan,150,175,200 Feb,165,190,210 Mar,170,205,180 | Month,Jan,Feb,Mar Product A,150,165,170 Product B,175,190,205 Product C,200,210,180 |
For the example above, the initial dataset includes the heading "Month" and the following column heads are products. Data is organised in rows with month numbers. When transposed, the first header column is "Month" and each of the original months (Jan, Feb, Mar) gets a new header column. Now, the product names (these were columns) are row labels. This transposes the data to a format that is sometimes necessary for time-series analysis, or to create certain sorts of charts, where the time dimension needs to be across the top. The tool’s algorithm ensures that each data point (say 150 for Product A in Jan) maintains the right relationship in the new structure.
Typical Data Transposition Scenarios
Data transposition is a basic data wrangling job found in many fields. It’s rarely about making data “look different” and nearly always about having it “work correctly” with a certain instrument, standard or analytical method. Sometimes it is necessary to turn rows into columns to solve compatibility problems, to prepare data for some statistical algorithms or just to make a given dataset easier to read for the audience. Here are some of the most common situations when you will find this converter invaluable.
Data Preparation For Visualisation Software
Tools like Tableau, Power BI, and many JavaScript charting libraries typically want data in a “wide” format where time periods, categories, or series are defined as column headers. If your source data exports out in a 'long' format (e.g. a column for 'Date', a column for 'Product' and a column for 'Value'), you may need to pivot it such that each product has a column of values. Our converter can swiftly convert lengthy format data to broad format needed for good visualisation.
Reformatting Exports from DB or API
Sometimes database queries and API answers produce data in a normalised, row-oriented structure that’s not optimal for summary reporting. For example, a query might return user attributes in different rows (UserID, AttributeName, AttributeValue) You may pivot this data, which can transpose the data into one row per user, with attributes as columns. This creates a nice denormalised table that is great for a contact list or report.
Statistics Modelling and Analysis
Some statistical methods and machine learning algorithms are orientated in a specific way, like for example in R or pandas in Python. Each variable may be expected in its own column, e.g. for a correlation matrix computation, or a time-series forecast model. Data transposition is an important first step in helping to ensure that your data frame is properly formatted for these advanced analytical procedures.
Frequently Asked Questions
New users commonly ask similar questions about the capabilities, restrictions, and best practices for utilising a data transposition tool. The FAQ section answers the most common questions and helps to use the converter correctly and understand how it fits into your data processing workflow. If you don’t find your query answered here, make sure that your input data is clean and in the regular CSV/TSV format, with a consistent delimiter.
Is the tool compatible with Excel files (.xlsx or .xls)?
No, not directly. This is a utility for text-based formats like CSV and TSV. To utilise it with an Excel file, you will need to save or export your Excel sheet as a “CSV (Comma delimited)” or “Text (Tab delimited)” file from within Excel. and open the saved .csv or .txt file in a text editor, copy contents and paste into the converter.
What if my rows have a different amount of columns?
The tool needs a rectangular data structure to do precise transposition. If the number of fields in the rows is inconsistent (e.g., one row has 5 cells, another row has 4), the transposition logic will not work and you will get a clear error message. Please check your source data for blank cells or missing rows and add or delete as needed prior to pasting.
Is it possible to transpose a portion of my data instead of the whole data?
The tool will process whatever you paste into the input field. But if you want to transpose a subset solely, you first need to isolate that particular chunk of data within your source application (e.g. Excel). Copy the rows and columns you want to transpose, including the header row you want to include, then paste just that selection into the converter.
Why would I want to select the "Quote all fields" option?
Quoting all fields puts double quotes around each cell (e.g., "data"). This is useful if your data contains commas, line breaks, or the delimiter character you choose. Quoting protects these special characters from being regarded as field separators, and so protects the data from corruption when the output file is opened by another program.
Is my data secure? Is it sent to your server?
Privacy is important to you. This utility is 100% web-based and operates in your web browser using JavaScript. The data you paste is never sent anywhere, it is processed locally on your PC. None of the data is sent to any server, so that proprietary or sensitive information is kept fully confidential.
Best Practices for Clean Data Migration
To ensure a smooth and error-free transposition experience, it is highly advised to follow a few best practices in preparing your data. Good structured input gives you perfect output. These suggestions are focused on pre-processing actions you can take in your original data source (such as Excel or Google Sheets) to prevent frequent mistakes and make sure the converter works flawlessly every time.
- Start with a Clear Header Row: Make sure that the first row of your data has clear, descriptive column names and no special characters that might interfere with delimiters.
- Use Consistent Delimiters: Ensure that the entire dataset utilises the same delimiter character. Mixed delimiters (i.e. commas in some rows and semicolons in others) will create parsing errors.
- Identify Missing Values: Fill or standardise empty cells. You may want to use a placeholder such as “N/A” or “0” to maintain the rectangular nature of your data grid.
- Escaping Internal Delimiters: If your data contains the delimiter character (e.g., a comma in a company name such as "Acme, Inc."), be sure to quote those fields in your source before copying.
- Copy Values Only: Copy the raw values, not the formulas or cell formatting. If necessary, as an intermediary step, paste from your spreadsheet as "Values Only" to a plain text editor.
- Always use the preview table: Review the preview table that is generated. The easiest way to catch any unexpected results is to do it immediately as a visual feedback before you export.
Common Problems and Their Solutions
Although you have made ample preparation, you may find a problem now and then. In most cases, the issue is a mismatch between the tool's expectations and how your pasted data is structured. This troubleshooting guide will help you rapidly identify and fix the most common mistakes so you can go back to a successful conversion. The trick is to examine your input data format and consistency stepwise.
Tool reports error: “Number of columns inconsistent across rows”.
This is the most common mistake. This signifies that one or more rows in your data have a different number of fields (cells) than the header row. Open your data in a text editor, and with "show invisibles" or similar, you can see tabs or spaces. Manually count delimiters in every line. The fix is to update your source data to have each row complete and the exact same number of delimiters.
Output after transpose seems jumbled or mis-aligned.
Usually, this means that the "Input Delimiter" option is incorrect. If your data is tab-separated and you have selected “Comma”, then all the data will be considered as one column. You might try changing the Delimiter to Tab, Semicolon or Custom. You may test that the tool is operating successfully by loading the “Load Example” and transposing it before applying it to your own data.
The quoted text is not processed appropriately in the output.
The tool can cope with typical CSV quoting and will double up quotes within a field (e.g., "She said, ""Hello""). If your source data has non-standard escaping or single quotes, the parser can become confused. Try the "Quote all fields" option on output. Make sure your input is consistent with double-quote escaping.
The download file has a .csv extension, but it does not open successfully in Excel.
This may be the case with regional settings. In some places, Excel wants a semicolon (;) instead of a comma as a separator. Either : 1 ) Change the " Output Delimiter " to Semicolon before you download , or 2 ) Open the .csv in Excel , and manually define the comma delimiter using the " Text to Columns " import wizard.